Insights
The Insights page in Intellisync Solutions offers a comprehensive overview of your user statistics and activity. This guide will walk you through the key elements of the Insights page and how to interpret the data presented.
Overview of Statistics
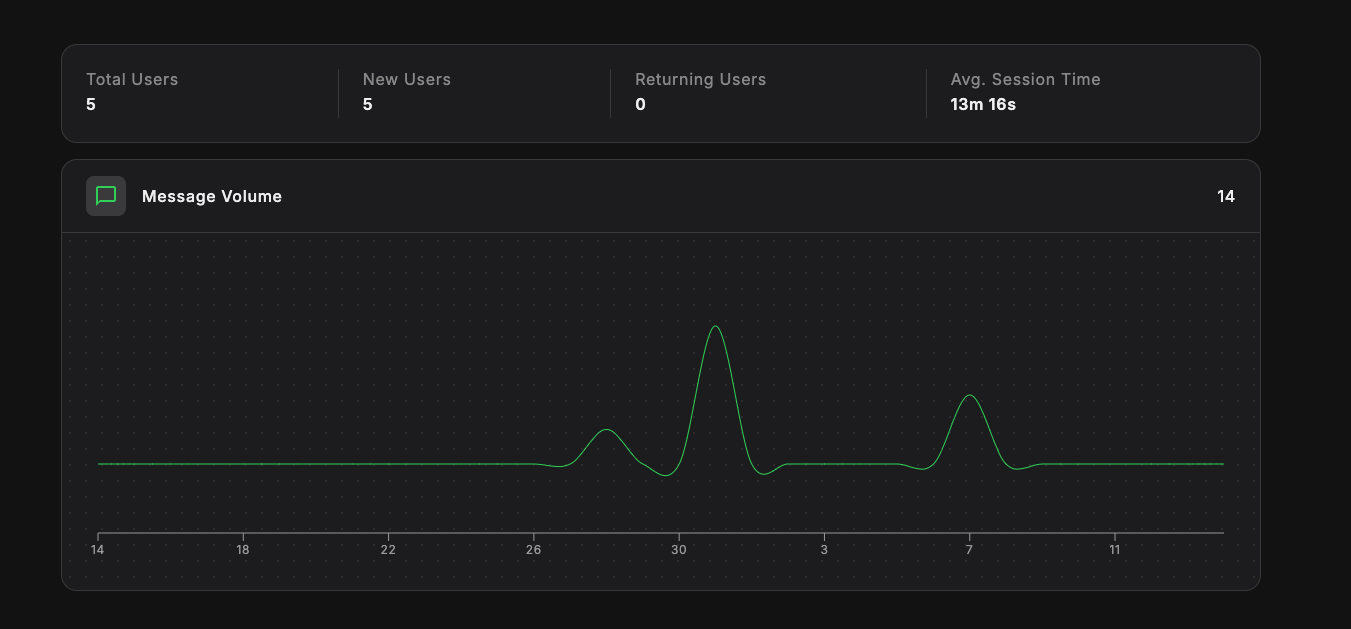
At the top of the Insights page, you'll find a summary of key metrics that provide a quick snapshot of your user activity:
- Total Users: This displays the total number of users who have interacted with your assistant.
- New Users: Shows the count of users who have interacted with the assistant for the first time within the selected time frame.
- Returning Users: Indicates the number of users who have returned for additional interactions.
- Avg. Session Time: The average duration that users spend interacting with the assistant during a session.

Message Volume
Below the summary statistics, you'll find a graph representing the Message Volume. This graph shows the number of messages exchanged over time, giving you a visual understanding of the interaction trends.
- The x-axis represents time, broken down by the selected period (e.g., day, week, month).
- The y-axis shows the number of messages exchanged.
This graph can help identify peak interaction periods and analyze user engagement trends.

Time Period Selection
In the top-right corner of the page, you can filter the data by time periods using the dropdown menu. The available options include:
- Today: View data for the current day.
- Week: Aggregate data over the past 7 days.
- Month: Displays statistics for the current month.
- Quarter: Shows data for the current quarter.
- Year: Provides an overview for the current year.
This sorting feature allows you to focus on specific timeframes to better analyze user behavior and engagement.
Interpreting the Data
By regularly reviewing the Insights page, you can:
- Track Growth: Monitor the increase in new and returning users.
- Analyze Engagement: Understand how users are interacting with your assistant over time.
- Optimize Performance: Identify patterns in usage that can inform improvements to your assistant's responses and functionalities.
Use these insights to continuously improve user experience and drive better results with your AI Assistant.